Advanced AI Analysis
Advanced AI Analysis is a deeper AI-assisted stock report. It helps you read a stock through a structured view of direction, confidence, supporting reasons, and risk notes.
Use it as research support. It is not a guarantee, and it is not personalized financial advice.
Where to Find It
Advanced AI Analysis appears in the analysis workspace with the other research tools.
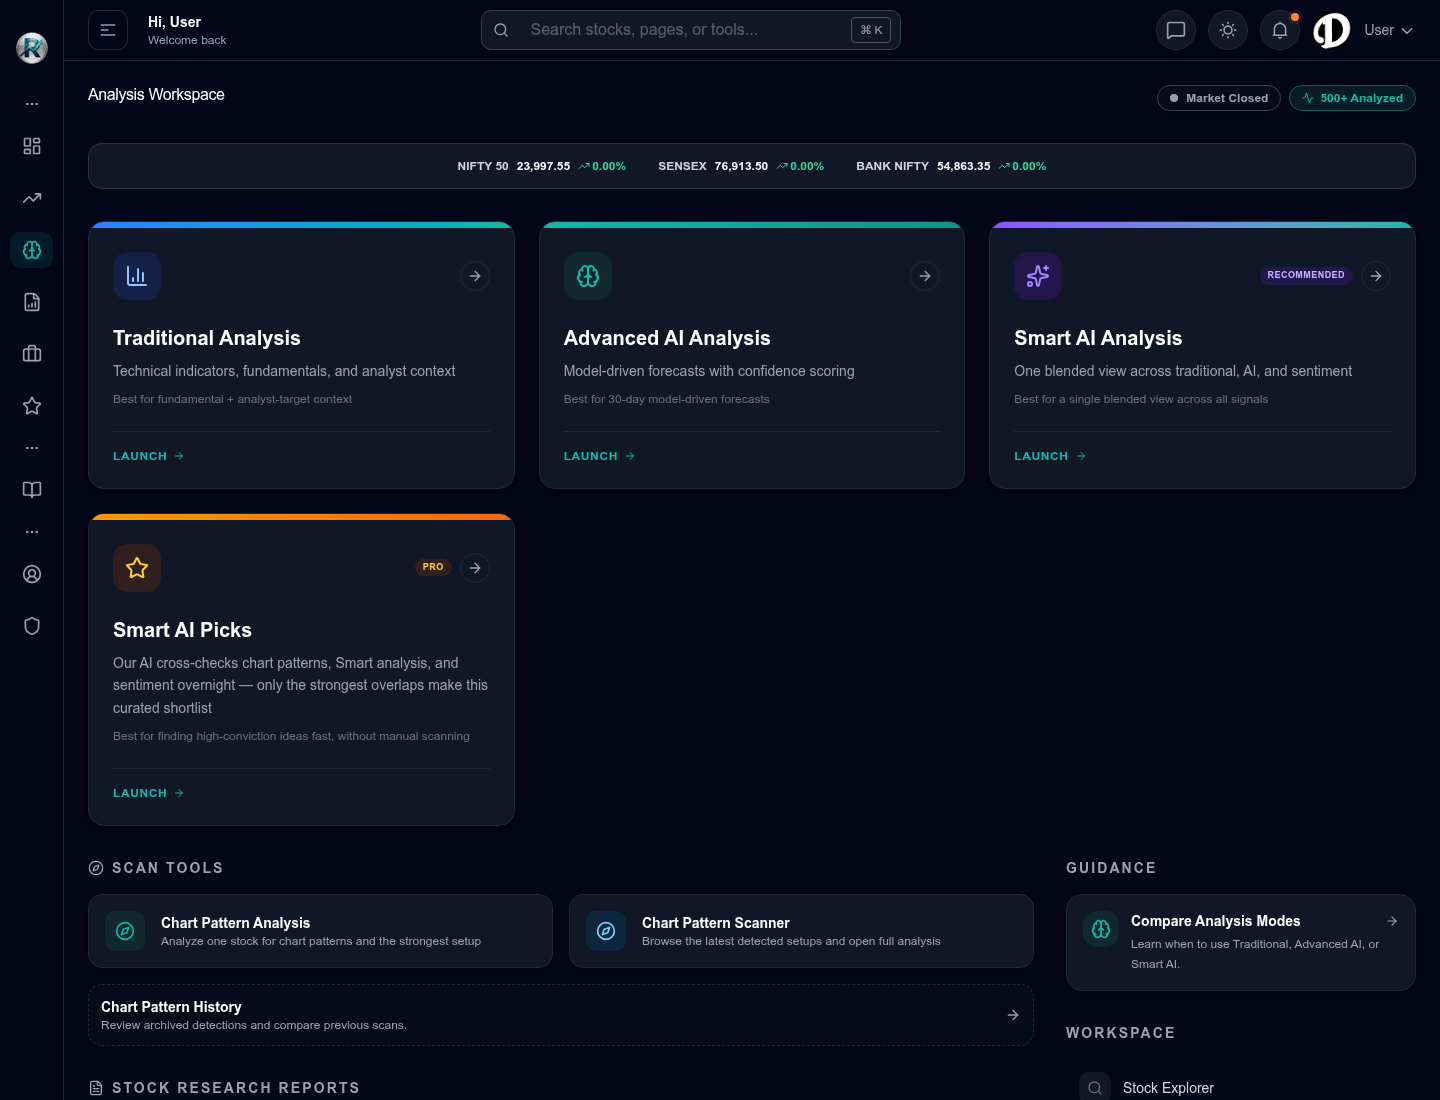 Analysis workspace showing the main RightStockAI research tools.
When to Use This Tool
Use Advanced AI Analysis when you want help answering questions like:
- What is the overall AI-assisted view on this stock?
- How confident is the report?
- What reasons support the view?
- What risks or caution points should I read before deciding?
- How does this compare with Traditional Analysis or Smart AI Analysis?
What the Report Usually Contains
Recommendation or Direction
The report may show a direction such as bullish, neutral, bearish, buy, hold, or sell-style wording. Treat this as the report's summary, not the full answer.
Always read the reasons and cautions before using the result.
AI Summary
The AI summary turns multiple signals into a short explanation. It should answer the question: "What is the report trying to say about this stock right now?"
Use the summary to orient yourself, then verify the details below it.
Confidence
Confidence explains how strongly the available signals support the report's conclusion.
- High confidence: stronger agreement across the inputs considered.
- Medium confidence: useful signals, but some uncertainty remains.
- Low confidence: mixed, weak, or unclear signals.
Confidence is not certainty. A high-confidence report can still be wrong if market conditions change.
Signal Context
Signal context explains the inputs that may have shaped the report. Depending on the page and available information, this can include price action, trend, financial context, news, sentiment, or comparison with another analysis view.
The important question is not "How many signals exist?" It is "Do the signals tell a consistent story?"
Supporting Reasons
Supporting reasons explain why the report reached its view. These may include price action, trend context, available financial context, market mood, news context, or comparison with other signals.
Use this section to decide whether the report is actually convincing.
Caution Points
Caution points explain why the report may be wrong or incomplete. They can include weak confidence, negative news, valuation pressure, stretched price action, market volatility, or unclear data.
If the caution points feel serious, treat the report as a prompt for more research rather than a decision.
Risk Notes and Cautions
Risk notes are just as important as positive reasons. They may point out volatility, weak momentum, valuation pressure, unclear data, market risk, or event risk.
If you skip this section, you may miss the main reason to wait, reduce exposure, or compare another tool.
Price and Target Context
Some reports may include price ranges, target-style context, or short-term and medium-term framing. Use those numbers as research context, not as guaranteed future prices.
A Simple Reading Order
- Confirm the stock name and symbol.
- Read the recommendation or direction.
- Check confidence.
- Read the top supporting reasons.
- Read every caution or risk note.
- Check the report date or last update time.
- Compare at least one other RightStockAI view.
Interpreting Common Results
| Result type | How to read it |
|---|---|
| Positive view with high confidence | Signals may be aligned, but still read risks and check report age. |
| Positive view with low confidence | The idea may be interesting but not strong enough alone. |
| Neutral view | The report may be waiting for clearer evidence. |
| Cautious view with strong reasons | Understand the weakness before comparing other tools. |
| Mixed reasons and cautions | Treat the stock as uncertain and slow down. |
Questions to Ask Before Acting
- Is the report fresh enough?
- Is confidence strong or weak?
- Are the supporting reasons specific?
- Are the caution points serious?
- Does Traditional Analysis agree?
- Does Smart AI Analysis agree?
- Is there recent news that changes the context?
- Does this stock fit my watchlist or portfolio purpose?
How to Compare It with Other Tools
Advanced AI Analysis plus Traditional Analysis
Use this pair when you want AI-assisted context and more conventional market analysis side by side.
Advanced AI Analysis plus Smart AI Analysis
Use this pair when you want to see whether the deeper AI view agrees with the blended smart view.
Advanced AI Analysis plus News
Use this pair when a stock is moving quickly and you need to understand whether recent events may be influencing the result.
Advanced AI Analysis plus Chart Pattern Analysis
Use this pair when the report looks interesting but you also want to study chart setup and price-pattern context.
If the Tool Is Locked or Limited
Some accounts may see a plan message or usage message before opening the report.
When that happens:
- Read the message shown on the page.
- Visit the live pricing page for current plan details.
- Contact support if you believe your account should have access.
This documentation does not list plan prices because pricing can change. The live pricing page is the current reference.
Best Practices
- Do not act from the headline alone.
- Compare the report with at least one other research view.
- Check whether the report is fresh enough for your decision.
- Treat low-confidence results as research notes, not action signals.
- Keep your own risk tolerance, time horizon, and portfolio exposure in mind.
- Avoid using AI output as a replacement for your own research.
Common Questions
Is Advanced AI Analysis a buy or sell instruction?
No. It is a research tool. You are responsible for your own decisions.
Why does the AI view differ from another tool?
Different tools weigh information differently. When reports disagree, read the reasons and risks instead of choosing the result you prefer.
Can the report change later?
Yes. Market data, news, and price action can change the context.
Should I use it for every stock?
Use it when you need deeper research. For quick monitoring, a watchlist or dashboard view may be enough.