Dashboard Overview
The dashboard is the first workspace most signed-in users see. It gives you a quick market snapshot before you open deeper research tools.
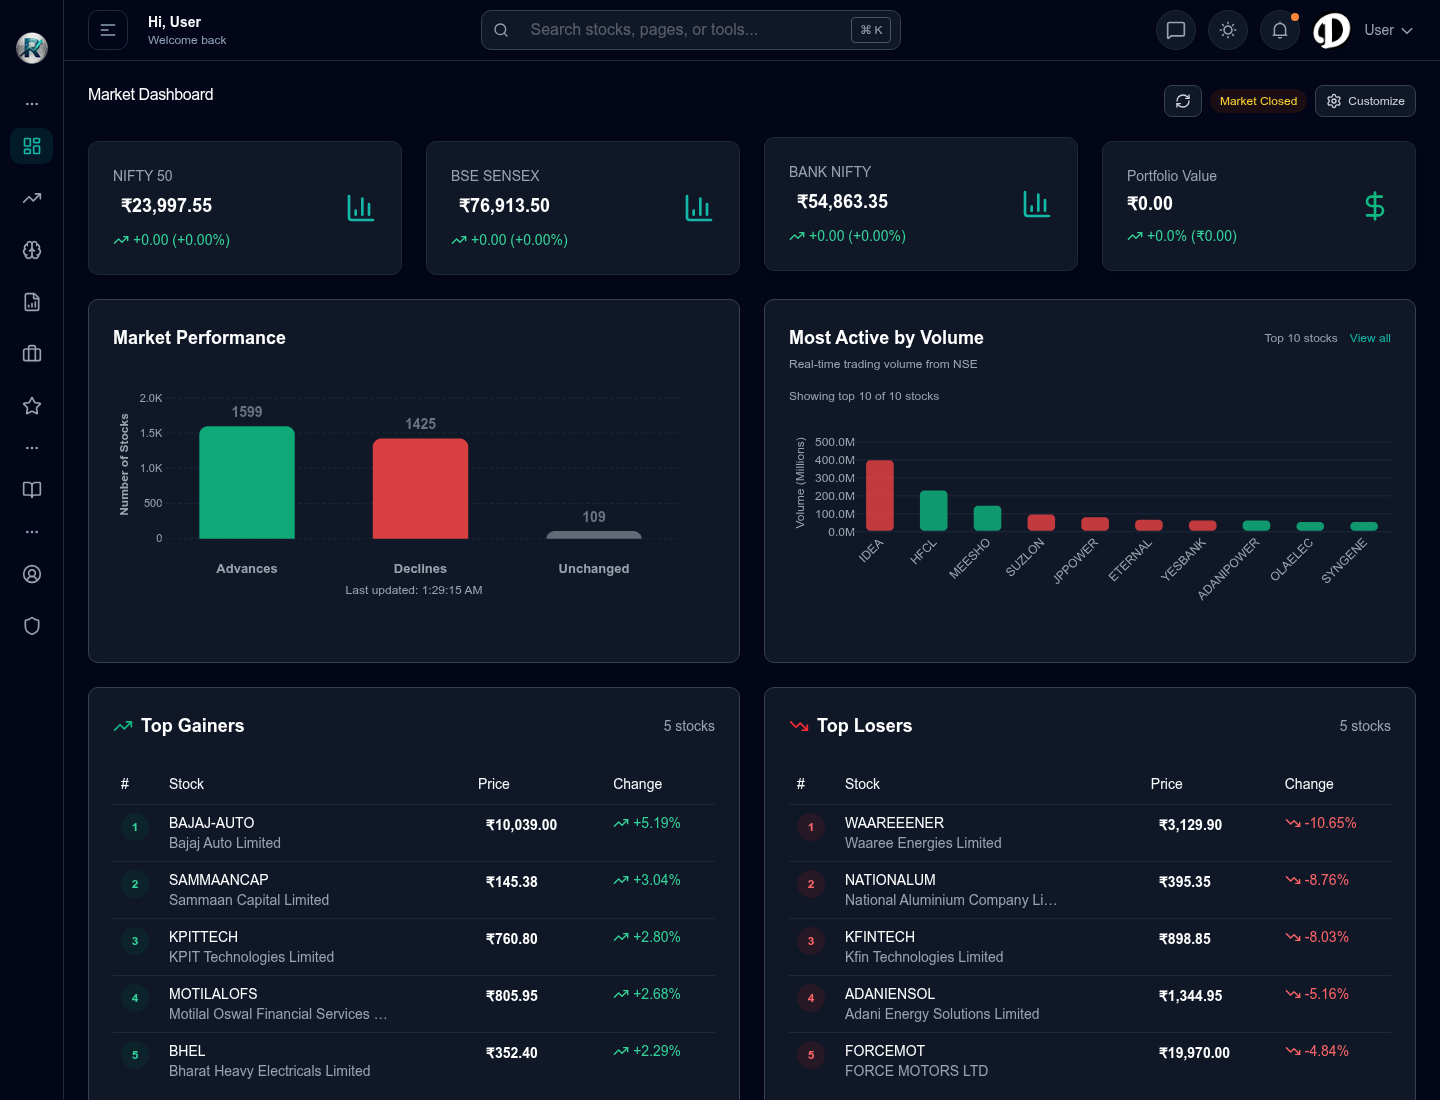 Desktop dashboard with market indices, market performance, active volume, gainers, and losers.
What You Can Do Here
Use the dashboard to:
- Check broad market direction before opening a stock report.
- See major index values such as NIFTY 50, BSE SENSEX, and BANK NIFTY.
- Review gainers, losers, and active-volume lists.
- Jump into search, analysis, portfolio, watchlist, and learning areas.
- Switch between desktop and mobile layouts without losing the main market view.
When to Use the Dashboard
Use the dashboard when:
- You are starting the day and want a broad read.
- You want to know whether the market is active, quiet, positive, or weak.
- You need a quick list of stocks moving strongly.
- You want to jump into search or analysis from one place.
- You are checking whether a portfolio or watchlist needs attention.
Reading the Market Cards
The top cards summarize the current market context.
Index value is the latest available value for that index.
Change and percentage show whether the index moved up or down from its previous reference point.
Market status tells you whether the market is currently open or closed. When the market is closed, use the numbers as the latest available snapshot rather than live movement.
Portfolio value appears when you use portfolio tracking. A zero value usually means you have not added holdings yet.
Market Performance
The market performance chart groups the day into:
- Advances: stocks that are up.
- Declines: stocks that are down.
- Unchanged: stocks with little or no movement.
This is useful for understanding whether a move is broad-based or limited to a smaller group of stocks.
How to read it:
- A market with many advances can support positive stock moves.
- A market with many declines can make even strong stocks harder to interpret.
- A mixed market means stock-specific research matters more.
Most Active by Volume
The volume chart highlights stocks with heavy trading activity. High volume does not automatically mean a stock is good or bad. Treat it as a signal to investigate why interest is high.
Good next steps:
- Open the stock page.
- Compare price movement with volume.
- Read the latest news and research context.
- Check whether the move is market-wide, sector-specific, or company-specific.
Gainers and Losers
The gainers and losers lists help you spot stocks moving strongly during the latest available session.
Use these lists for research ideas, not as instant buy or sell instructions. Fast movers can be volatile, and the reason behind the move matters.
Before opening a gainer or loser:
- Check whether the whole sector is moving.
- Check whether volume is high.
- Read recent news if available.
- Open a stock report only if the move is worth investigating.
Search and Quick Actions
The search area helps you move from the dashboard into a stock, page, or tool.
Use search when:
- You know the stock name.
- You know the symbol.
- You want to reach an analysis tool quickly.
- You do not want to browse through the side menu.
Mobile Dashboard
RightStockAI keeps the same market context on smaller screens with a stacked layout and bottom navigation.
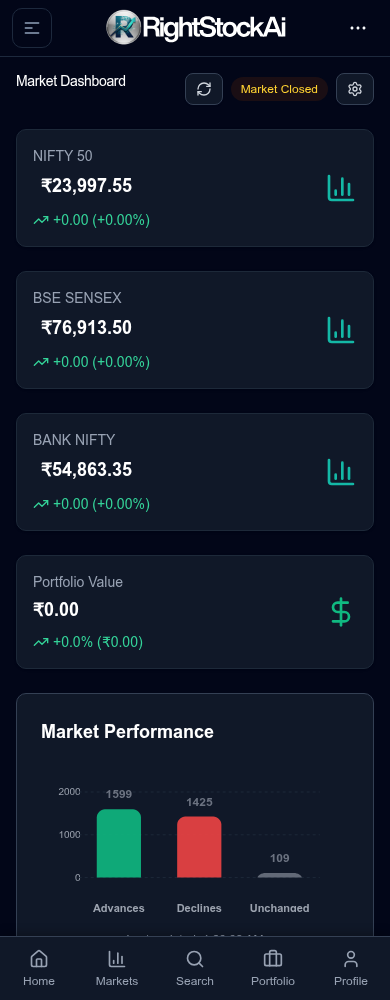 Mobile dashboard with stacked market cards and quick bottom navigation.
On mobile:
- Use the bottom navigation for Home, Markets, Search, Portfolio, and Profile.
- Open the menu button for the full navigation.
- Scroll vertically through the same market cards and lists.
- Use search when you want to jump directly to a stock or tool.
Common Questions
Why do values look unchanged?
The market may be closed, data may be between refreshes, or the selected index may not have moved since the last update.
Why is my portfolio value zero?
You may not have added holdings yet, or you may be viewing the dashboard before setting up a portfolio.
Should I act only because a stock appears in gainers or losers?
No. Use the list as a starting point, then read the stock report, risk notes, news context, and your own portfolio fit.