Your First Stock Analysis
This guide helps you run your first stock analysis without needing to understand every investing term upfront.
Start from the Analysis Workspace
After signing in, open the analysis workspace. It shows the main research tools in one place.
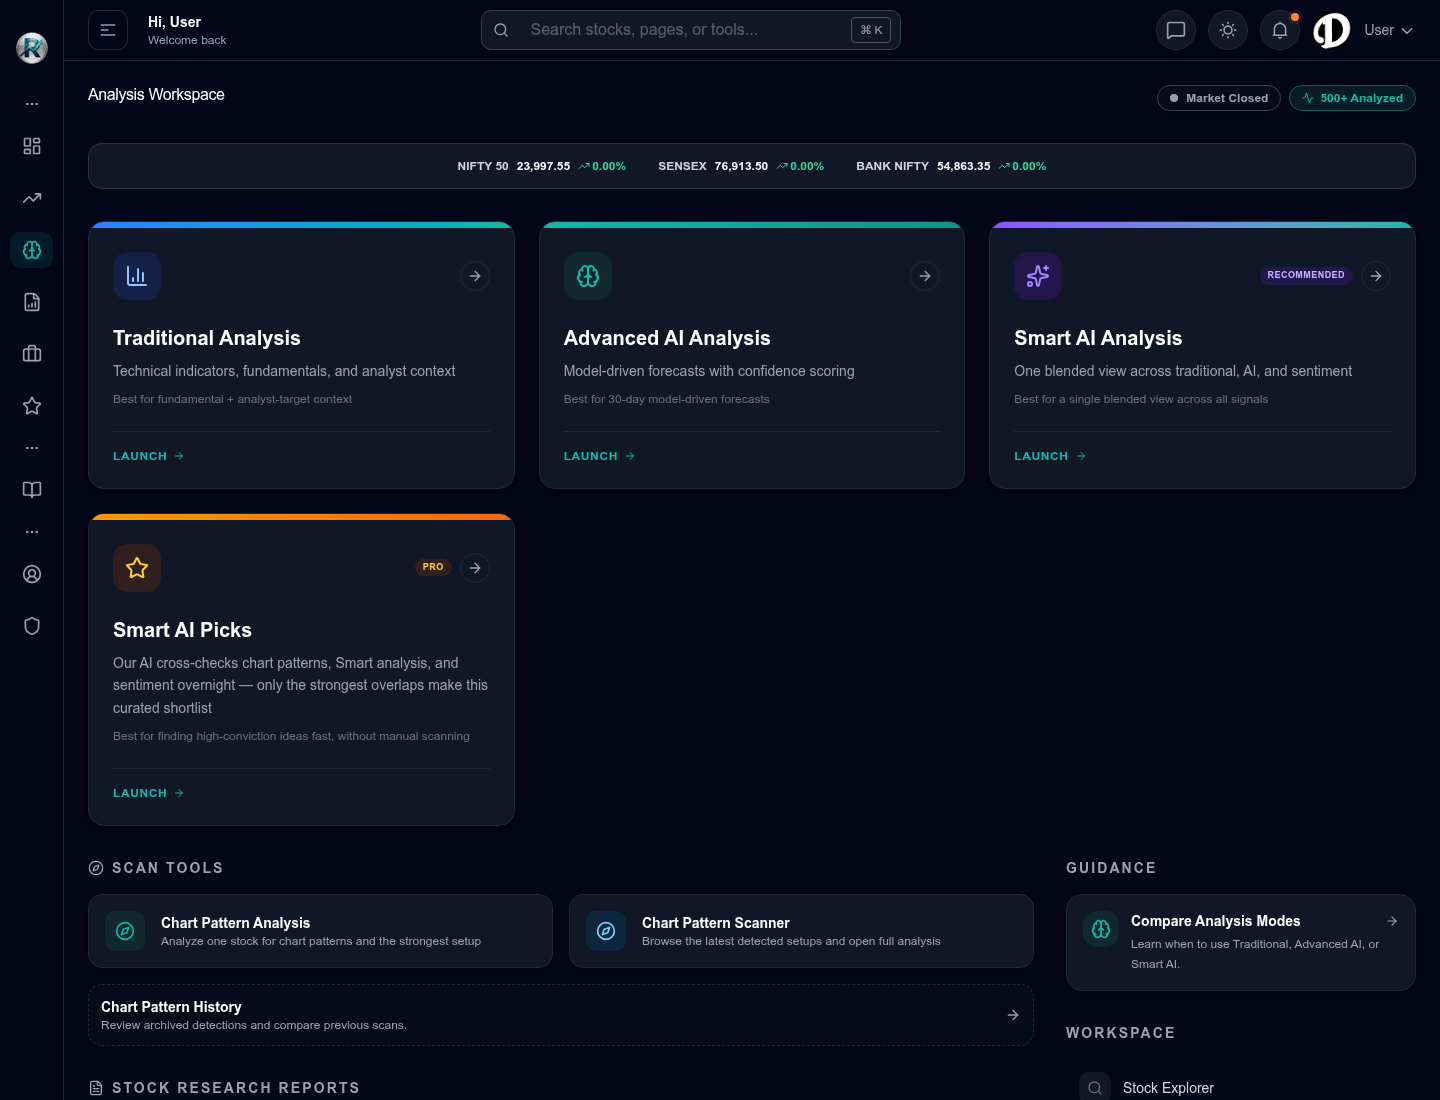 Analysis workspace with Traditional Analysis, Advanced AI Analysis, Smart AI Analysis, Smart AI Picks, chart-pattern tools, and research report shortcuts.
Step 1: Choose the Right Tool
You do not need to use every tool at once. Start with the tool that matches your question.
Traditional Analysis
Use this when you want a structured view of technical, fundamental, and analyst-style context.
Advanced AI Analysis
Use this when you want an AI-assisted report with confidence, reasons, and risk notes.
Smart AI Analysis
Use this when you want a blended view across traditional, AI, and sentiment-style signals.
Smart AI Picks
Use this when you want curated ideas that have stronger overlap across multiple research checks.
Chart Pattern Analysis
Use this when you want to study possible price-pattern setups for a stock.
Research Reports
Use this when you want saved research views or curated report lists rather than starting from a blank search.
For a first report, choose one stock you already recognize. It is easier to learn the report when you can connect the output to a real company you understand.
Step 2: Search for a Stock
Most analysis pages ask for a stock name or symbol.
Good search habits:
- Start with the company name if you do not know the symbol.
- Pick the correct listed stock from the suggestions.
- Check the exchange or company name before opening the report.
- Avoid running reports on names you are not sure about.
Step 2A: Confirm You Opened the Right Stock
Many companies can have similar names. Before reading a report, confirm:
- Company name.
- Symbol.
- Exchange or listing context when shown.
- Whether the stock is the one you intended to research.
This matters because a good-looking report on the wrong symbol is useless.
Step 3: Read the Summary First
The summary tells you the report's main direction in plain terms. Look for:
- The overall view, such as bullish, neutral, bearish, buy, hold, or sell-style wording.
- Confidence or score, if the report includes one.
- The main reasons behind the view.
- Caution points or risk notes.
- The report date or latest update time.
Do not skip the caution points. They explain what could weaken the report's conclusion.
Step 3A: Know the Main Report Sections
Most reports are easier to read when you know what each section is trying to do.
| Section | What it means |
|---|---|
| Summary | The report's short explanation. |
| Recommendation or verdict | The report's compact view, such as positive, neutral, or cautious. |
| Confidence | How strongly the available signals support the view. |
| Reasons | Why the report reached that view. |
| Cautions | What could go wrong or weaken the view. |
| Chart or levels | Price structure, support, resistance, target, or invalidation context when available. |
| News context | Recent developments that may affect interpretation. |
| Report date | Whether the report is fresh enough for your decision. |
Step 4: Understand Confidence
Confidence is not a guarantee. It tells you how strongly the available signals line up.
Higher confidence usually means the report found more agreement across the inputs it considered.
Medium confidence means the report has useful signals, but you should read the supporting details carefully.
Lower confidence means the signals may be mixed, weak, or uncertain.
When confidence is low, treat the report as a research note, not a decision.
Step 5: Read Reasons and Risks Together
A good reading habit is to pair every positive reason with the related risk.
Example questions to ask:
- Is the stock moving because of company news, sector movement, or broad market movement?
- Are the technical signals and business context pointing in the same direction?
- Is the report warning about volatility, valuation, weak momentum, or unclear data?
- Does this stock fit your time horizon and risk comfort?
Step 6: Compare Another View
Before acting, compare at least one other RightStockAI view.
Useful combinations:
- Traditional Analysis plus Advanced AI Analysis.
- Smart AI Analysis plus the latest news.
- Chart Pattern Analysis plus the main stock report.
- Research Reports plus your own watchlist notes.
When two tools agree, the idea may deserve closer review. When they disagree, slow down and read why.
Step 6A: What Disagreement Means
Disagreement is not a problem. It is useful information.
Examples:
- Traditional Analysis is positive, but AI News is cautious: recent events may be adding risk.
- Advanced AI is positive, but Chart Pattern Analysis is weak: the forecast view and price setup may not align.
- Smart AI is neutral: the inputs may be split.
- Chart Pattern Analysis is bullish, but fundamentals are weak: the setup may be short-term or fragile.
When tools disagree, write down the conflict in plain words before deciding what to do next.
Step 7: Save or Track the Stock
After reading the report, you can:
- Add the stock to a watchlist if you want to monitor it.
- Add it to a portfolio only if you own it or want to track a real holding.
- Set a reminder or alert when available.
- Come back later and compare whether the report changed.
Common First-Time Mistakes
Reading only the headline
The headline is only the starting point. The reasons and risks are where the useful context lives.
Treating confidence as certainty
Markets can move against any report. Use confidence as a quality signal, not a promise.
Ignoring the date
A report can become less useful when market conditions, news, or price action change.
Using one tool for every decision
Different tools answer different questions. Compare views when the decision matters.
Ignoring portfolio fit
A stock can look interesting but still be unsuitable if you already own too much of the same sector or theme.
Forgetting the market context
A stock can move because the whole market or sector is moving. Check the dashboard or market overview first when movement looks unusual.
Practice Exercise
Pick one familiar stock and write down:
- What the first report says.
- The confidence level.
- Two supporting reasons.
- Two caution points.
- Whether another tool agrees or disagrees.
- Whether the stock belongs in a watchlist or portfolio review.
This habit helps you learn the product faster than reading only the final recommendation.